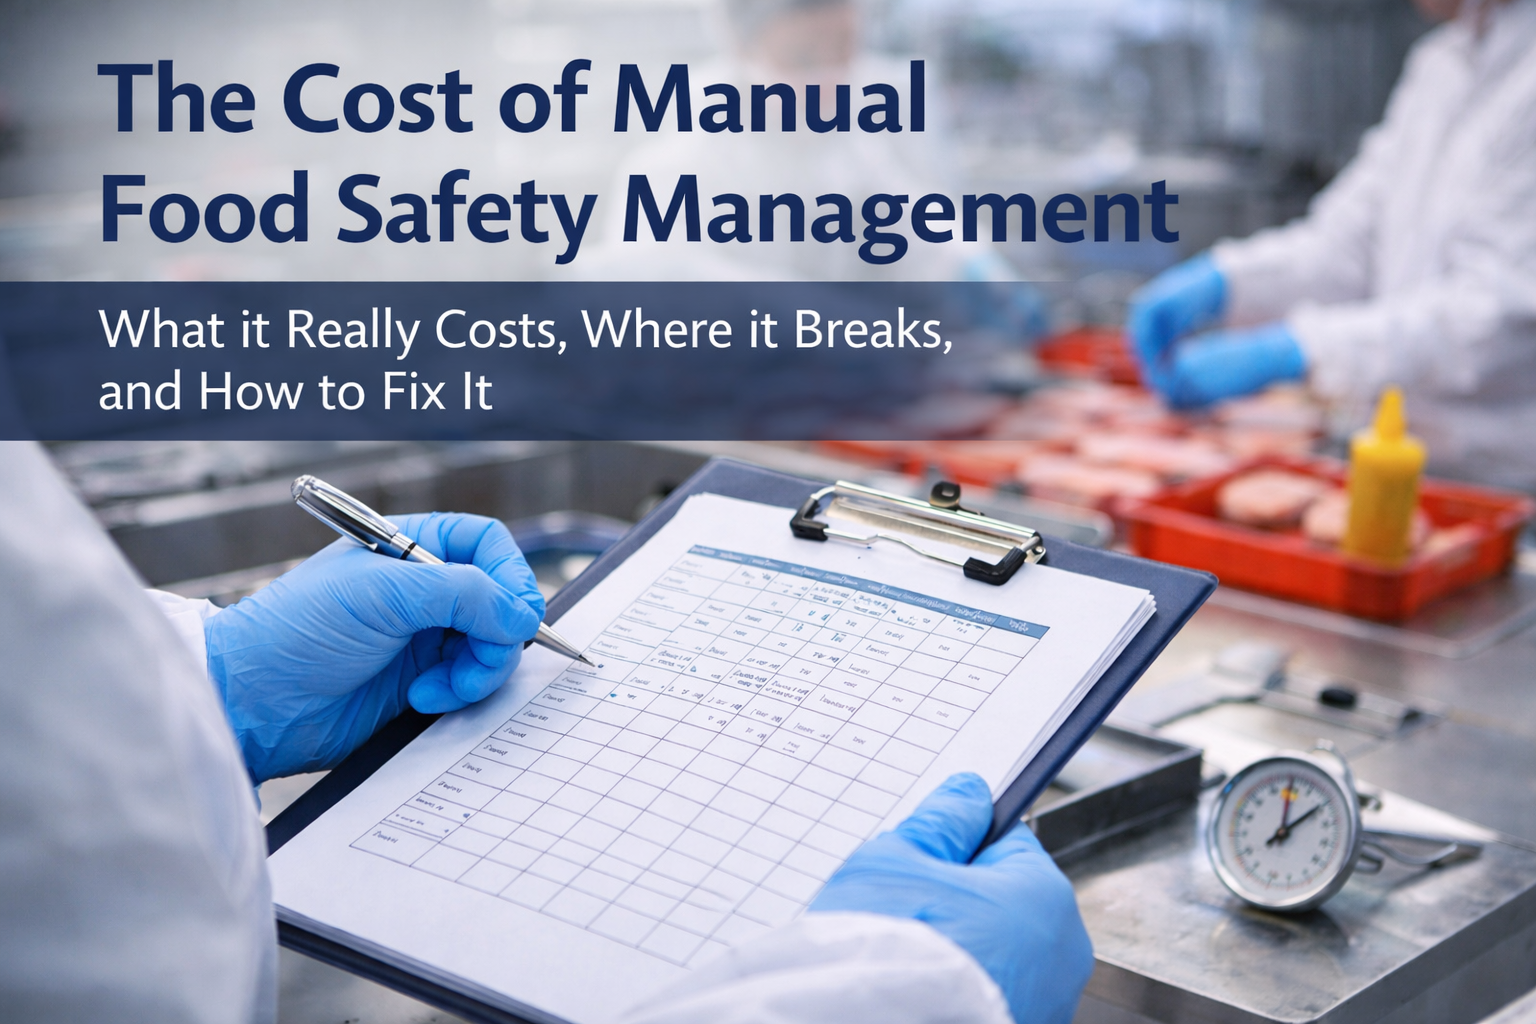
Food safety leaders don’t need platitudes—they need control. Real-time monitoring delivers exactly that: continuous visibility into conditions that make or break product safety and brand trust. Done right, it shrinks your detection window from days to seconds, converts clipboards into live dashboards, and turns audits from firefights into routine check-ins. Done wrong, it becomes noise, false alarms, and shelfware. This guide tells it like it is—what real-time monitoring actually means, where it pays off, where it bites, and how to implement it step-by-step with concrete examples your teams can execute.
What “Real-Time” Really Means (And Why It Matters)
Real-time monitoring captures, transmits, and analyzes critical control data as it happens, not hours later during paperwork review. In practice, that means:
-
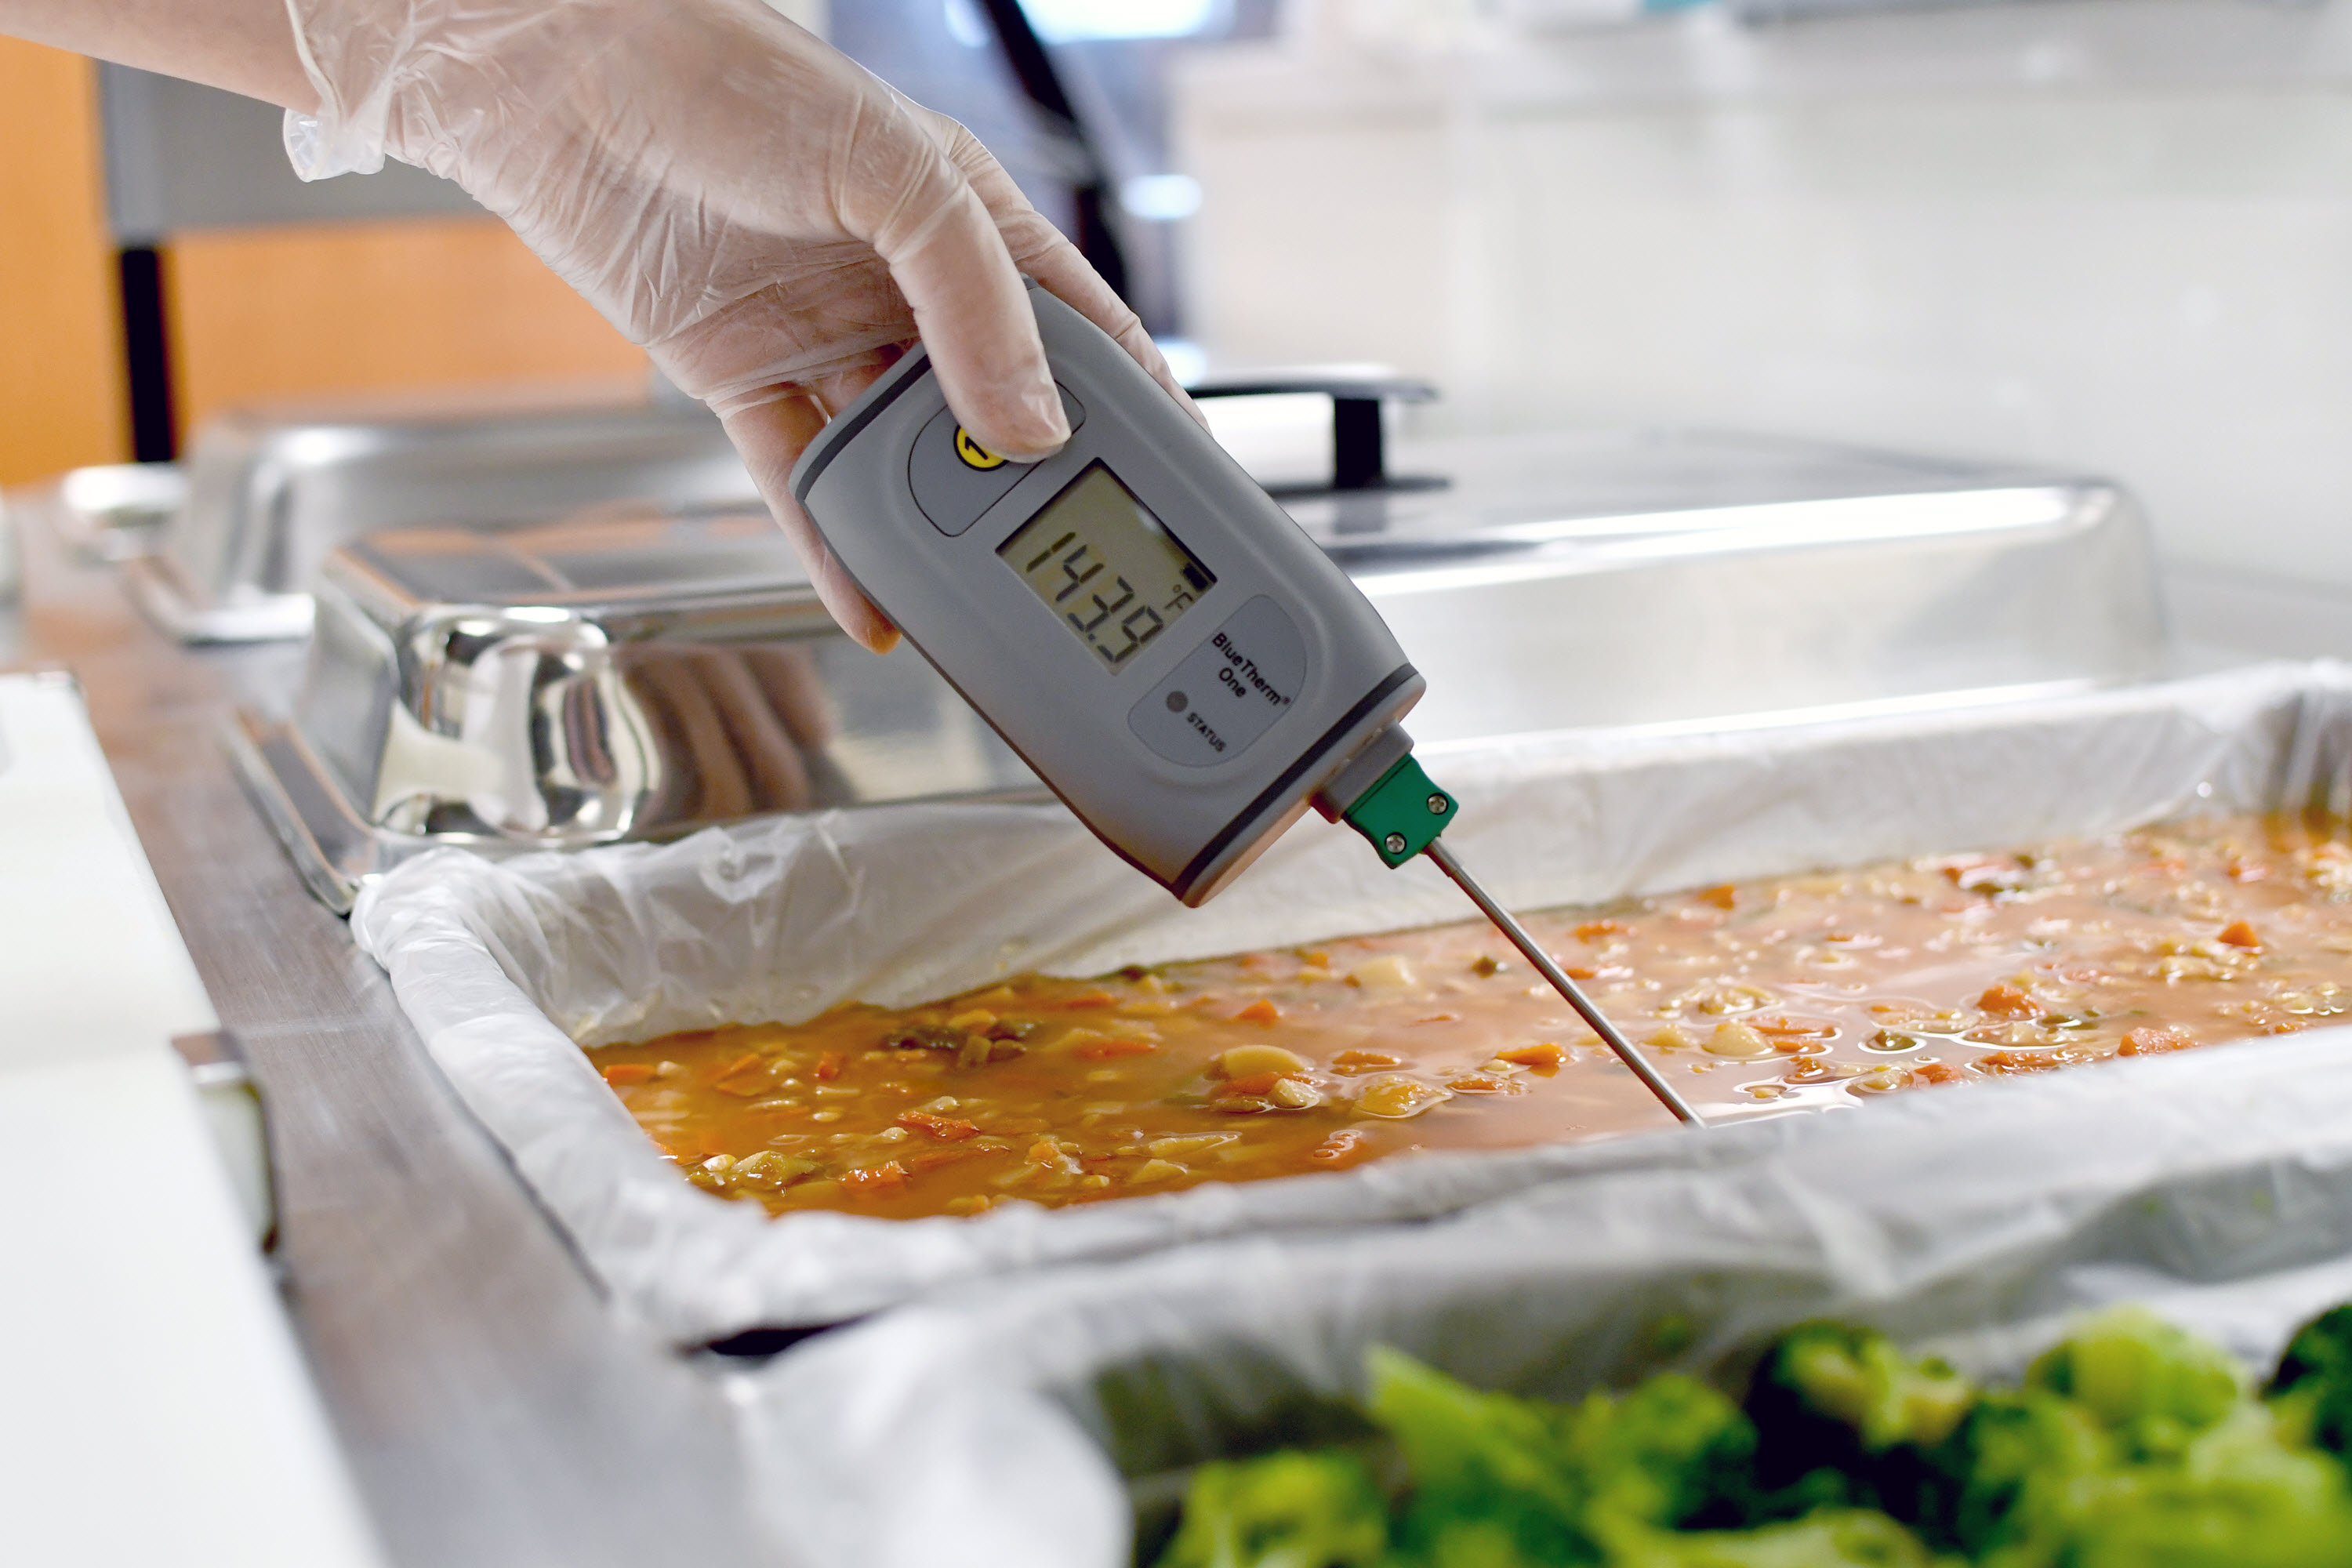
Sensors and data sources: temperature probes, humidity and differential pressure sensors, pH/ORP meters, chlorine analyzers, ATP instruments, metal detectors/X-ray systems, vision systems, weigh scales, flow meters, CIP skids, line PLCs, and even operator checklists on mobile devices.
-
Connectivity layer: wired/wireless gateways (Wi-Fi, BLE, LoRaWAN, cellular), edge computing for buffering and validation, and secure transport to a cloud or on-prem platform.
-
Platform: food safety software that ingests the data, validates ranges, stamps time/user/lot, triggers alerts/escapes, and stores tamper-evident records.
-
Workflow: role-based dashboards, escalation rules, CAPA linkage, and audit trails integrated with HACCP/PCP plans and supplier records.
-
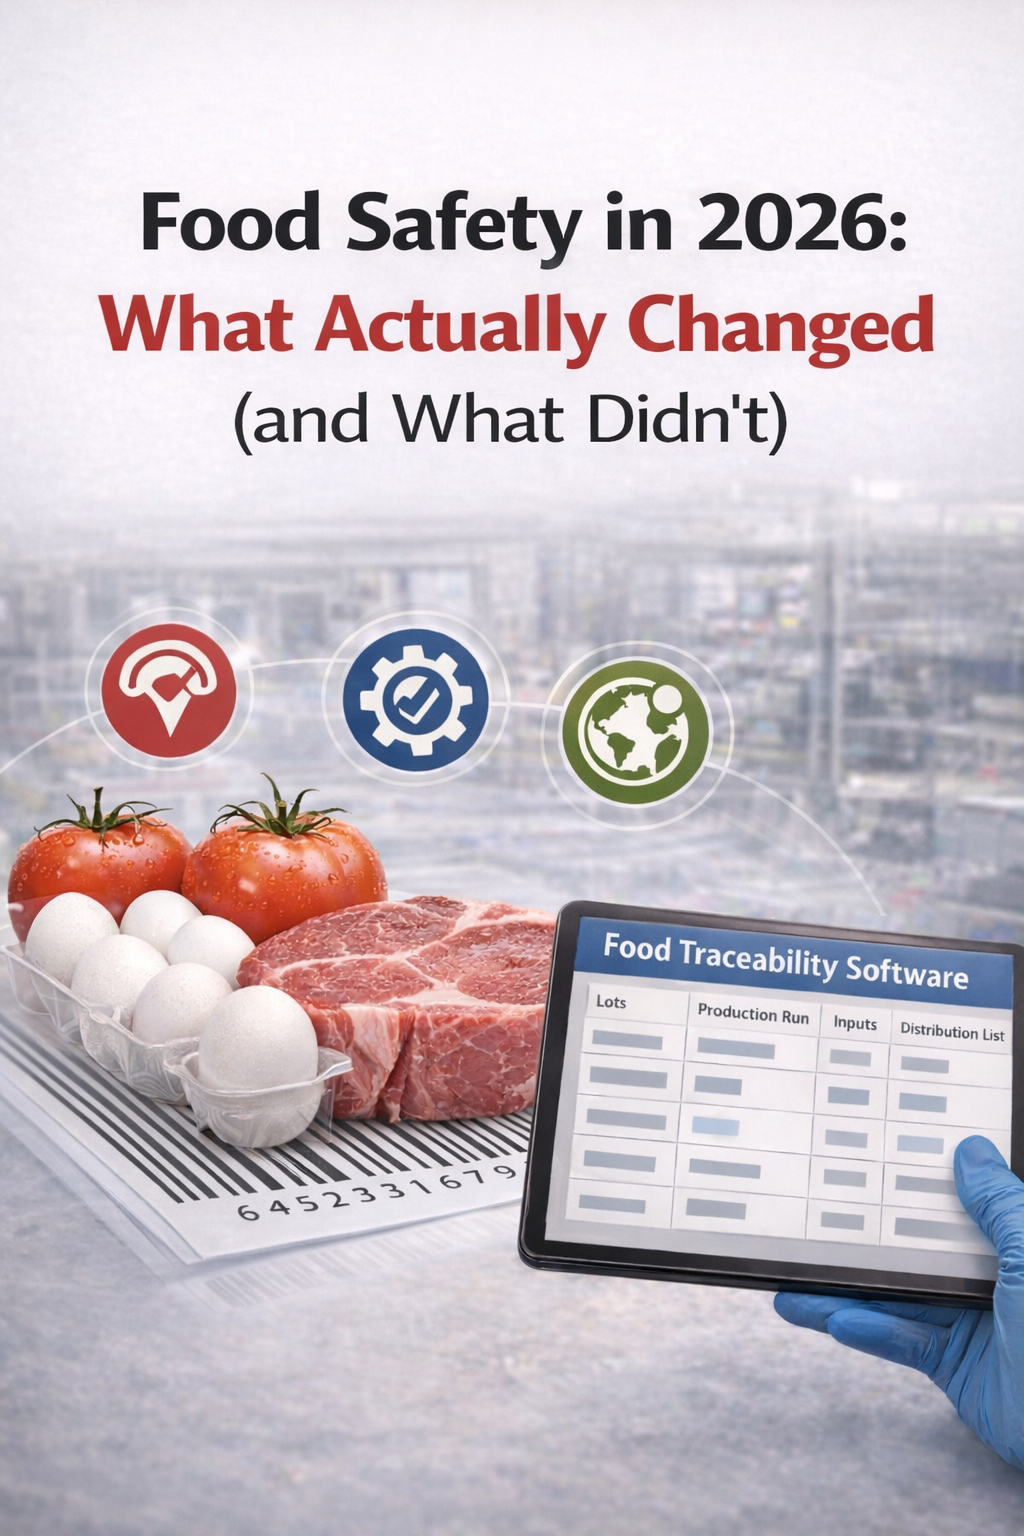
Traceability: link readings to materials, equipment, lots, and shipments so that “which lots were at risk?” is answered in seconds.
Why it matters: every hour of delay between a deviation and action compounds risk—microbial growth in a warm cooler, allergen carryover from incomplete cleaning, sanitizer concentrations drifting out of spec, or condensation creating Listeria-friendly niches. Real-time compresses the detection-to-response interval and gives you continuous verification that your controls are actually working—not just “checked” on paper.
Where Real-Time Monitoring Changes the Game
-
Faster detection & response. Automatic alerts when CCP limits are breached (e.g., cooler >4 °C for 10 minutes) enable immediate triage—move product, fix the door seal, document disposition.
-
Continuous verification. Instead of periodic checks, you get stream data. That enables SPC trending (statistical process control) to catch drift before it becomes a deviation.
-
Audit-ready records—without the scramble. Immutable, time-stamped, user-attributed logs reduce audit prep time and help satisfy HACCP, HARPC/FSMA Preventive Controls, CFIA PCP, BRCGS, SQF, and ISO 22000 requirements.
-
Root-cause analysis and traceability. Integrate with food traceability software to correlate events: Which lots were on Line 3 during the metal detector failure? Which pallets sat in the warm zone of Cooler B on Saturday?
-
Supplier oversight. Monitor inbound temperatures, seal integrity, and delivery dwell times to enforce specifications and tighten receiving CCPs.
-
Labor efficiency. Automated capture replaces manual rounds and duplicate entry. Operators spend time fixing issues, not writing them down twice.
-
Predictive maintenance. Trends in compressor cycling, pump current, or CIP return temperatures can forecast failures. Fix before downtime, contamination, or scrap.
-
Culture of accountability. Transparent dashboards reduce “data massaging” and make problems visible—early, fact-based, and fixable.
Common Pitfalls (Don’t Sugar-Coat These)
-
Alert fatigue. If everything pings, nothing gets fixed. Poor thresholds and missing deadbands swamp teams.
-
Data without decisions. A dashboard isn’t a plan. If SOPs don’t spell out who does what, when, and how to document it, you’ll have pretty graphs and ongoing risk.
-
Calibration and validation gaps. Sensors drift. If you don’t schedule calibrations, verify against traceable standards, and document MSA (measurement system analysis), regulators will (rightly) question the numbers.
-
IT/OT security blind spots. Unpatched gateways, shared passwords, and flat networks invite trouble. Security belongs in scope from day one.
-
Disconnected systems. If your platform can’t talk to ERP/MES/CMMS/LIMS, you’ll be stuck with swivel-chair integration and lost context.
-
Change management. People resist. Without training, role clarity, and leadership support, adoption lags and ROI evaporates.
Step-By-Step Implementation Playbook
1) Define Objectives & Risk Scope
Start with the hazards that hurt you most—pathogens in RTE, allergen cross-contact, time-temperature abuse, sanitation lapses, water chemistry drift. Translate these into measurable parameters and decision triggers.
Deliverables: objectives, prioritized hazards, success criteria (e.g., “95% reduction in temperature excursions >10 minutes within 90 days”).
2) Map Your Process & CCPs
Create a precise map of unit operations from receiving to shipping, marking CCPs and CPs (e.g., pasteurization, chilling, metal detection, CIP). Identify where data already exists (PLCs, SCADA, lab) and where you need sensors.
Deliverables: annotated process map, data inventory, gap list.
3) Select Sensors & Data Sources
Choose devices with food-grade enclosures, appropriate IP rating, resolution, and accuracy. Standardize where possible to reduce calibration complexity. Consider edge devices that buffer during outages and validate against rules locally.
Deliverables: sensor list, installation plan, calibration schedule.
4) Build Secure Connectivity
Decide on network architecture (VLANs for OT, WPA2-Enterprise for Wi-Fi, cellular for remote sites). Implement TLS encryption, unique credentials, and least-privilege policies. Plan for offline resilience (store-and-forward).
Deliverables: network diagram, security controls, failover plan.
5) Choose Your Platform (Don’t Under-spec It)
Adopt food safety software that can ingest diverse data streams, enforce digital SOPs, and link readings to lots, equipment, and people. Must-haves:
-
Configurable limits, deadbands, and escalations
-
Audit trails and e-signatures (21 CFR Part 11–style controls are a plus)
-
APIs or native connectors to ERP, MES, LIMS, CMMS
-
Mobile workflows for holds, rework, and release
-
Analytics and role-based dashboards
6) Set Limits, Alarms, and Escalations
Base thresholds on validation studies and regulatory/standard requirements. Use pre-alarm bands to warn before a breach. Define escalation ladders: operator → supervisor (10 min) → QA manager (30 min) → plant manager (60 min).
Deliverables: limit tables, alarm logic, notification matrix.
7) Codify SOPs Around the Data
For each deviation: who investigates, how to quarantine product, what checks to perform (e.g., probe core temps), how to document disposition, and how to launch CAPA if recurrence occurs.
Deliverables: deviation SOPs, hold/release SOPs, CAPA templates.
8) Pilot on One Line or Area
Prove capability in a high-risk, high-visibility area (e.g., RTE chilling or cold storage). Measure MTTA (mean time to acknowledge) and MTTR (mean time to resolve) before/after. Tune thresholds and workflows.
Deliverables: pilot report, tuned configs, go/no-go criteria.
9) Train & Roll Out in Waves
Train operators, QA, maintenance, and supervisors. Use real incidents from the pilot in training scenarios. Roll out in manageable waves (one line, one area, one plant).
Deliverables: training materials, competency checks, phased plan.
10) Governance, Data Integrity & Retention
Establish ownership for:
-
Master data (lines, equipment, CCP definitions)
-
Access control and periodic reviews
-
Calibration evidence and MSA records
-
Backups, retention (often 2–5 years), and disaster recovery tests
-
Change control (document how limits change and why)
11) Integrate With Enterprise Systems
-
ERP/MES: link lots, work orders, and release status.
-
CMMS: auto-generate work orders when patterns indicate equipment drift.
-
LIMS: unify environmental and finished-product results with process data.
12) Monitor KPIs and Improve
Track:
-
% readings within spec
-
deviations per 1,000 readings
-
MTTA, MTTR
-
CCP downtime minutes per week
-
Holds initiated/resolved
-
Audit findings related to monitoring
Run quarterly reviews to adjust thresholds, SOPs, and training.
Concrete Examples (Use These as Templates)
1) Cold Chain Control in Ready-to-Eat Seafood
Risk: L. monocytogenes growth from temperature abuse.
Setup: Wireless temperature loggers in dock doors, coolers, and reefer trailers; door-open sensors; dashboard with excursion rules (>4 °C for >10 min).
Workflow: If a cooler breaches, the system triggers a hold on all lots entering that cooler during the window, notifies QA and maintenance, and logs corrective actions.
Impact: 70–90% reduction in excursions, faster root-cause (bad door gasket vs. compressor cycling), and defended shelf-life claims.
2) Allergen Changeover on a Snack Line
Risk: Peanut residue on a line scheduled for “no declared allergens.”
Setup: Digital sanitation checklist + ATP luminometer readings linked to equipment ID; camera validation of critical disassembly points; limit = ATP < specified RLU.
Workflow: If any ATP > limit, automatic re-clean step unlocks only after re-test passes. Line stays in “yellow” status in the MES until cleared.
Impact: Documented verification, fewer reworks, stronger recall defense.
3) CIP Verification in Dairy
Risk: Inadequate pasteurizer cleaning leading to biofilm.
Setup: Real-time monitoring of CIP return temperature, flow, conductivity, and exposure time; rule that all four parameters must meet validated targets.
Workflow: Failed cycle triggers line hold, CMMS ticket for valve inspection, and QA review.
Impact: Lower microbial counts, fewer customer complaints, and cleaner inspections.
4) Metal Detector Integrity Checks for RTE Meals
Risk: Physical hazard from detector drift.
Setup: Scheduled online challenge with ferrous/non-ferrous/SS wands. System blocks production if a challenge fails and requires a documented retest after corrective action.
Impact: Detects drift early, tightens audit posture, less manual paperwork.
5) Environmental Monitoring Program (EMP) Watch
Risk: Listeria harborage in Zone 2/3.
Setup: Combine swab results with humidity and air-handling differential pressure sensors; alert on condensation-prone conditions (high RH + temp delta + door open time).
Impact: Proactive interventions before swab positives climb; fewer sporadic hits.
6) Utility Quality: Process Water & Compressed Air
Risk: Water sanitizer below spec; compressed air dew point too high for packaging.
Setup: Online chlorine analyzer and dew-point sensors with thresholds and CAPA triggers.
Impact: Prevents silent risks that otherwise show up only in periodic checks.
Regulatory Alignment (North America & Global Schemes)
-
HACCP & PCP (CFIA): Real-time data provides monitoring records, verification, and corrective action evidence tied to CCPs.
-
FSMA Preventive Controls: Supports preventive controls, environmental monitoring, and supply-chain program verification with electronic records.
-
BRCGS/SQF/ISO 22000: Demonstrates systematic control, data integrity, and management review with KPIs and CAPA tracking.
-
21 CFR Part 11-style controls: While not always required, e-signatures, audit trails, and user authentication strengthen compliance posture.
Bottom line: regulators care less about your brand of sensor and more about whether you control hazards and prove it with valid, tamper-evident records and effective corrective actions. Real-time monitoring, when integrated into your plan, does exactly that.
Data Integrity & Cybersecurity—Non-Negotiables
-
Calibration & MSA: Documented schedules, traceable standards, and periodic bias/precision checks.
-
Time sync: NTP across devices so time stamps align with lot and shift changes.
-
Access control: Unique user IDs, MFA for admin roles, least privilege.
-
Audit trails: Every change to limits, SOPs, or records is tracked—who, when, why.
-
Encryption & segmentation: TLS in transit, encrypted storage, network segmentation between IT and OT.
-
Backups & retention: Tested restores, clear retention aligned with customer/regulatory expectations.
If your platform can’t meet these basics, keep looking.
The ROI—Where the Money Shows Up
-
Waste & rework avoided: catching temperature or chemistry drift early saves entire lots.
-
Labor reclaimed: fewer manual rounds and no double-entry.
-
Audit cost down: faster retrieval of defensible records; fewer findings related to monitoring.
-
Insurance & customer confidence: stronger posture can reduce premiums and keep top customers happy.
-
Uptime gains: predictive maintenance from pattern analysis prevents costly line stops.
Executives want a simple equation: (Incidents avoided + Hours saved + Uptime gained) – (Sensors + Platform + Change management). With a focused rollout, payback often occurs within a year—sometimes within a few months in high-risk, high-waste areas.
Implementation Timeline You Can Actually Hit
-
Weeks 0–2: Scope, risk mapping, sensor shortlist, platform configuration sandbox.
-
Weeks 3–6: Install pilot sensors, connect gateways, configure limits & SOPs.
-
Weeks 7–8: Pilot run, tune alarms, train users.
-
Weeks 9–12: Wave 1 rollout (e.g., cold storage + sanitation), KPI baseline and report.
-
Quarterly: Add lines/areas, refine governance, expand analytics (SPC, predictive).
This is aggressive but realistic when leadership backs the change and roles are clear.
Practical Tips That Save Headaches
-
Start where the risk and payback are highest. Cold chain and allergen changeovers are usually quick wins.
-
Tune alerts ruthlessly. Use deadbands, hysteresis, and pre-alarms to stop noise.
-
Instrument the environment, not just the product. Humidity, pressure, and door-open time predict issues.
-
Close the loop. Every alert should generate a record with cause, action, and product impact decision.
-
Standardize. The fewer sensor models and workflows, the easier calibration and training become.
-
Measure adoption. If MTTA/MTTR aren’t improving, revisit training and escalation.
Bringing It All Together
Real-time monitoring is not a gadget; it’s an operating discipline. It integrates validated sensors, secure connectivity, and food safety software that enforces your plan in the flow of work. The payoff is tangible: fewer incidents, faster decisions, cleaner audits, and a stronger brand.
If you want to see how a modern platform unifies sensors, digital SOPs, traceability, and CAPA—without the noise and with the governance auditors expect—book a live demo: https://normex.ca/demo.
No fluff. Just clearer control over the variables that matter most.

